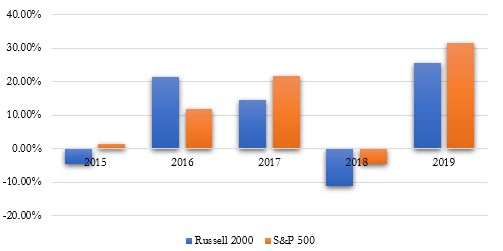
The so-called “size premium”, which says that the growth potential in small cap companies compensates for their increased risk, has a long-standing historical precedence. In Dr. Kenneth French’s research on factor investing, he showed that the bottom quintile of stocks in terms of market cap have returned 11.7% annually since July 1926, while the top quintile returned 9.8%. Recent years have not been so favorable to small cap stocks, as the Russell 2000 has lagged the S&P 500 Index every year since 2017 (see Figure 1 below). We attribute this recent under-performance to a few factors, namely a global economic slowdown, a corresponding reversal of Zero-Interest Rate Policy (ZIRP), and an easing of trade tensions.
Figure 1: Cumulative Return of Russell 2000 and S&P 500 Index

Rising rates disproportionally impact smaller companies since (1) such companies are more reliant on short-term revenue and (2) since funding business operations with increasingly more expensive debt is a drag on future profitability. Following the 2008 Housing Crash, the Bernanke led Fed slashed interest rates in an effort to spur economic activity. The effective Fed Funds Rate stayed below 50bps until December 2016, when the Federal Reserve began to gradually reverse course under the leadership of first Janet Yellen and then Jerome Powell. This cycle of rate increases, which continued until the middle of 2019, could help explain why small cap companies have been struggling to keep up with large cap companies as of late.
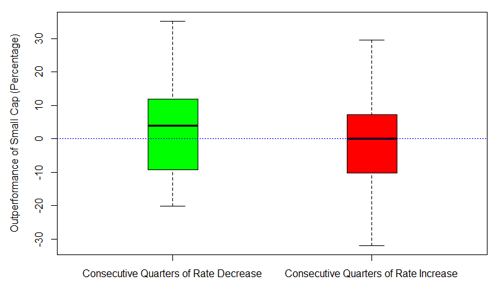
Figure 2 below shows how large cap stocks tend to be more resilient in rising rate environments, while small cap stocks tend to outperform when there is an abundance of cheap money. The boxplots examine all the instances since 1960 where there have been consecutive quarters of rising or falling rates, and then shows the relative outperformance of the Russell 2000 compared to the S&P 500. Values below 0 indicate that the S&P 500 had a higher return during the period, and values above 0 indicate the Russell 2000 did. One can see that in falling rate environments, small cap tends to outperform large cap by a median 3%.
Figure 2: Comparative Size Premium Based on Rate Environment

In addition to rising rates, easing trade tensions may have disproportionally helped large multinationals. According to FactSet, about 38.3% of S&P 500 company’s revenue comes from overseas, while just 21.3% of Russell 2000 company’s revenue does. We see this a benefit to small cap companies in the medium-term, since a strong U.S. consumer has managed to maintain moderate economic growth (2.3% GDP growth in 2019) compared to other developed economies such Germany (0.8%), France (1.3%), and Japan (1.0%).
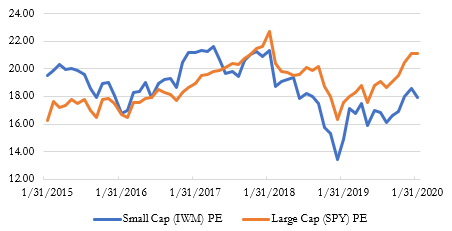
Recent interest rate cuts, a potential pickup in economic growth, and cheap valuations are all possible catalysts to help small cap catch up. The PE multiple for small cap companies is usually slightly higher than large caps to account for added growth potential. Recently however, the PE ratio of large cap companies has grown faster than that of small cap companies. In Figure 3, one can see how the PE ratio of large cap companies overtakes that of small cap companies just as returns for large caps begin to outpace small caps. This lends evidence that recent outperformance by large caps can be attributed to PE expansion rather than preferable income statements.
Figure 3: Comparative PE Ratios

In light of these factors, it may be an opportune time to increase one’s small cap exposure. Julex Capital’s True Alpha Small Cap strategy may be a good choice. As of 12/31/2019, the strategy has outperformed the Russell 2000 by over 6% annually gross of fees (with similar volatility characteristics) since its inception in April 2018. It places an emphasis on selecting a concentrated portfolio of undervalued, high-quality stocks, and rebalances quarterly. For more information about this strategy, please visit our website (www.julexcapital.com).
