The equity markets had a tough month in October. Several factors were blamed for the selloff.
- Quick interest rate increase. The U.S. 10-year government bond yield surged to 3.25%, in early October, the highest since 2011. Higher interest rates could potentially have negative effects on growth and valuation, hurting the high fliers like growth/tech companies the most.
- Trade war. The conflict with China started to show some negative impacts. Softer China demand was flagged by several companies in recent days. Chip makers like Micron and Lam Research, being more dependent on exports to China, have been struggling for a while.
- Peak margin concerns. Recent rising labor costs and raw material prices may reduce profit margins.
- Systematic selling pressure. Commodity trading advisers and risk parity funds typically reduce exposures when volatility spikes or market trends deteriorate.
- Buyback blackout period. Normally, a company cannot buy its shares back two weeks before the quarter end until the earnings release.
- Uncertain mid-term elections. The most likely scenario is the Democrats take the House and the Republicans maintain control of the Senate. It is possible we will see more gridlocks and dysfunctions in Washington over next two years.
Corporate earnings were strong in Q3, but many firms lowered their guidance. Among the 74% of companies in the S&P 500 Index reporting results, 78% have beaten earnings estimates and 61% have beaten sales estimates. The blended earnings growth rate for the S&P 500 was 24.9%, the highest rate since Q3 2010, according to FactSet.
The S&P 500 SPDR ETF (SPY) declined by 6.91%, while the small cap stock ETF (IWM) dropped by 10.99%. The developed market equity ETF (EFA) and the emerging market equity ETF (VWO) both lost ground. Gold (GLD) moved higher in this flight-to-quality environment, but the commodity index (DJP) moved lower. The fixed income asset classes generated negative returns when interest rates rose. The long-term Treasury bond ETF (TLT) tumbled by 2.93% (see Figure 1). Market volatility, as measured by the S&P 500/CBOE option implied volatility (VIX), jumped to 21.23% at the end of October.
Figure 1: Asset Class ETF Performance – October 2018
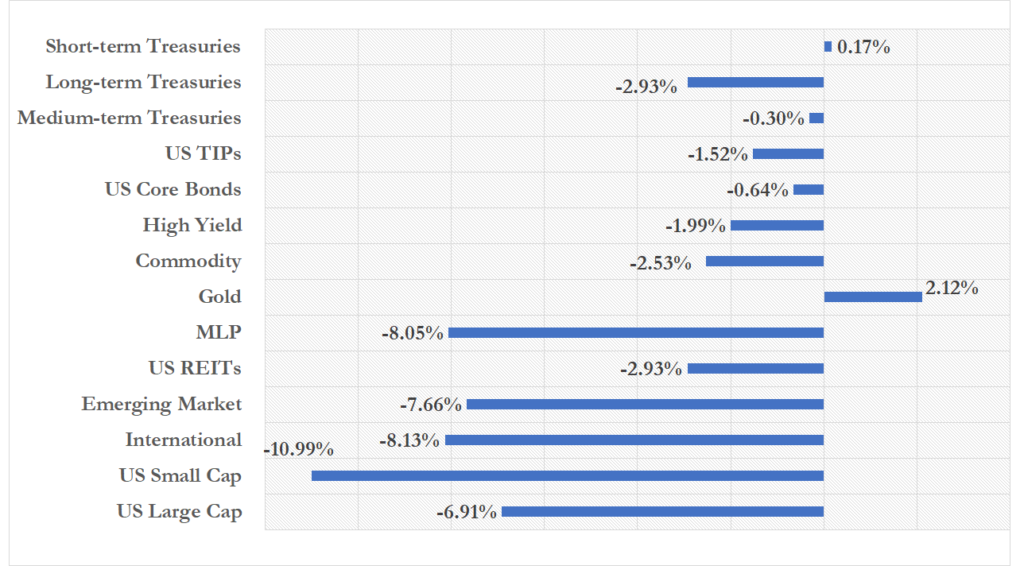 Data Sources: FactSet
Most of the sectors had negative performance. Defensive sectors outperformed cyclical sectors, large Cap stocks outperformed small cap stocks, and value outperformed growth. Consumer staples (XLP) and utilities (XLU) generated positive returns, up by 2.00% and 1.98%, respectively. The worst performers were small cap growth (IWO) and industrials sector (XLI), down by 12.64% and 10.87%, respectively.
Figure 2: Equity Sector ETF Returns – October 2018
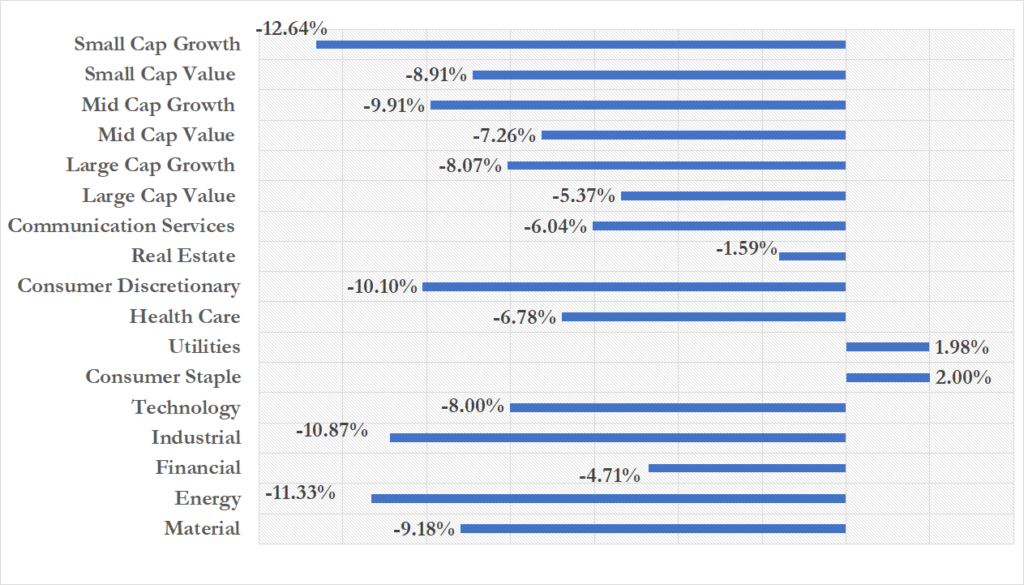
Data Sources: FactSet