Jeremy Grantham, one of the most notable “top-down” value investor, recently had a changing heart on value investing. In his widely-read quarterly newsletter titled “This Time Seems Very, Very Different”, he noticed the average P/E ratio of the S&P 500 after 1996 was 65% to 70% higher than the long term average. He attributed higher profit margin and lower interest rates to the higher P/E ratio, and concluded “it seems likely we will have a longer wait than any value manager would like (including me)” for “a more or less permanent move back to, or at least close to, the pre-1997 trends of profitability, interest rates and pricing.”
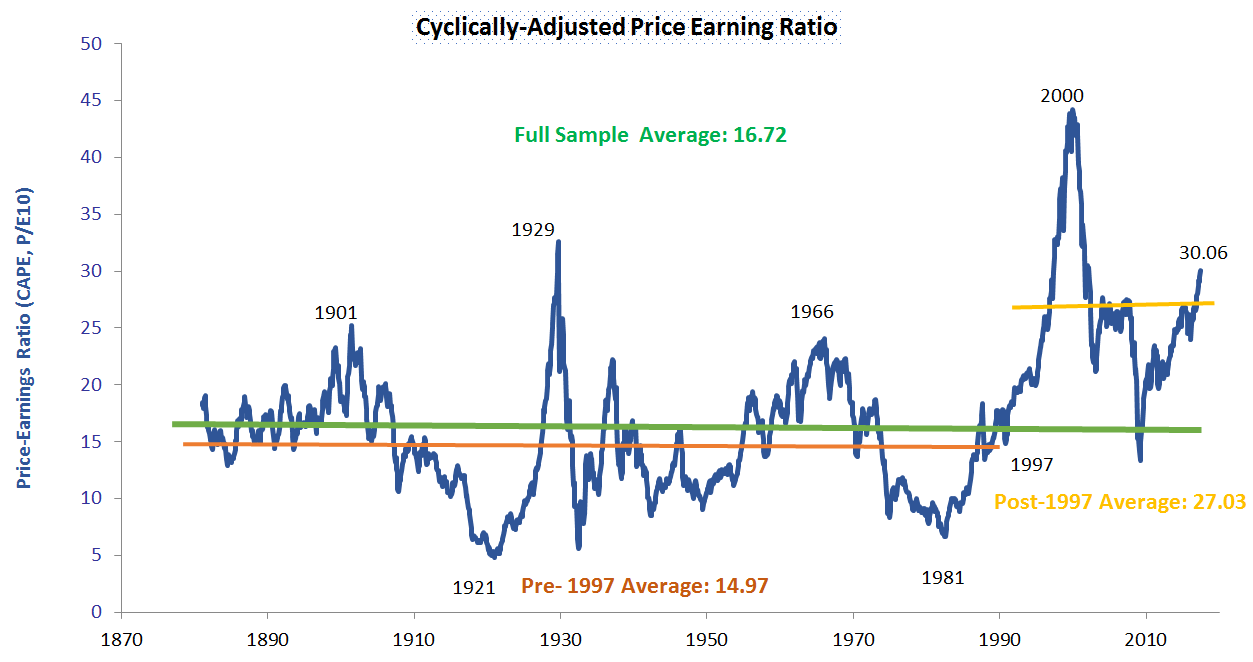
Figure 1 illustrates the historical cyclically-adjusted price earnings ratio (CAPE) since 1881. CAPE was calculated by Yale Professor Robert Shiller by using average earnings over a 10-year time frame instead of the trailing twelve-month earnings to remove the cyclicality of corporate earnings. Obviously, the post-1997 average CAPE is much higher than its pre-1997 level.
Value investing, a strategy of buying cheap assets and capturing the excess returns when they recover eventually, relies on the mean reversion of asset valuation. The ‘top-down” value market timing approach practiced by Mr. Grantham calls for overweighting equities when their valuation is below mean (cheap) and under-weighing equities when their valuation is above mean (expensive). The approach will outperform a static asset allocation when the equity valuation reverts to its mean. An interesting question is: if the mean equity valuation becomes unstable over time, can it still serve as a robust timing indicator? To answer this question, we will test a simple timing strategy with Shiller PE as follows:
- When Current Shiller PE > (historical mean + one standard deviation), 100% of the portfolio is in T-Bills;
- When Current Shiller PE < (historical mean – one standard deviation), 100% of the portfolio is in S&P 500 Index;
- Otherwise, 50% is in S&P 500 Index and 50% is in T-Bills.
That means, when the market is overvalued by more than one standard deviation above the historical mean, the strategy over-weights T-bills. Conversely, when the market is undervalued by more than one standard deviation below the historical mean, the strategy over-weights equities. The benchmark for this strategy is a static portfolio of 50% S&P 500 and 50% T-Bills. The back test results are summarized in Table 1.
Table 1: Back Test Results of Timing Strategy with Shiller PE
| Timing Strategy with Shiller PE | Benchmark(50% SP 500 index + 50% T-Bill) | |
| Full Sample: 1934-2016 | ||
| Average Annual Return | 7.1% | 7.3% |
| Standard Deviation | 7.0% | 6.4% |
| Maximum Drawdown | 23.1% | 27.1% |
| Pre-97: 1934-1996 | ||
| Average Annual Return | 8.2% | 7.9% |
| Standard Deviation | 7.7% | 6.4% |
| Maximum Drawdown | 23.0% | 22.8% |
| Post-97: 1997-2016 | ||
| Average Annual Return | 3.8% | 5.4% |
| Standard Deviation | 4.3% | 6.6% |
| Maximum Drawdown | 23.1% | 27.1% |
Source: Julex Capital, Shiller and Federal Reserve St. Louis
Over the full sample period between 1934 and 2016, the timing strategy underperformed the benchmark by 20 bps annually, as shown in Table 1. In the pre-1997 period, the strategy fared better, outperforming benchmark by 30 bps annually, but in the post-1997 period, the strategy did much worse, underperforming the benchmark by 160 bps annually. This result seems to confirm the observation made by Mr. Grantham that the mean equity valuation has become much higher after 1996. Consequently, the strategy over-weighted T-Bills most of the time in the post-1997 period, resulting in significant underperformance. Another interesting result from Table 1 is that this valuation-based timing strategy does not improve the portfolio risk significantly in terms of maximum drawdown and standard deviation, either. Investors who want to use the timing strategy as risk reduction vehicle will be certainly disappointed.
In summary, valuation may not be a good timing indicator for asset allocation because the mean valuation metrics tend to be unstable over time. In the last twenty years, as Mr. Grantham suggested, higher profit margin, as a result of globalization and increasing corporate power, may allow for higher valuation than the historical norm. Unfortunately, this change of mean was only recognized after the fact. Finally, we conclude with Mr. Grantham’s warning: “We value investors have bored momentum investors for decades by trotting out the axiom that the four most dangerous words are, ‘This time is different’. For 2017, I would like, however, to add to this warning: Conversely, it can very dangerous indeed to assume that things are never different.”
_______________________________________________________________________________
Disclosure: This article is for the purpose of information exchange only. It is not a solicitation or offer to buy or sell any security. You must do your own due diligence and consult a professional investment advisor before making any investment decisions. All information posted is believed to come from reliable sources. We do not warrant the accuracy or completeness of information made available and therefore will not be liable for any losses incurred.