When Congress amended the Federal Reserve Act in 1977, it provided the Fed with their so-called “dual mandate”: promote price stability and ensure maximum employment. To achieve these aims, the Fed primarily influences the Fed Funds Rate (FFR), the rate that banks charge each other for overnight loans. While the metric that the Fed targets hasn’t changed, their approach to influence it certainly has. In this article we briefly explain the specifics of these changes as well as touch upon the impact they have had on the yield curve.
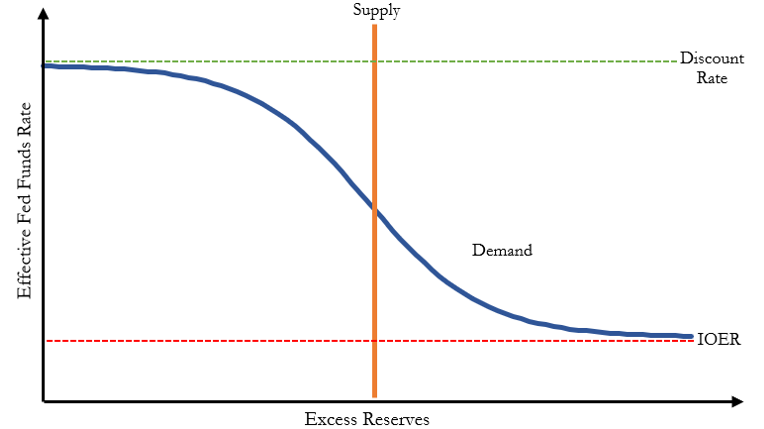
From the 1970s until the housing bubble, the tools the Fed used to alter the FFR were relatively limited. The demand for reserves was a product of the macroeconomy, and the supply was a product of Fed policy. To alter supply, the Fed would perform normal open market operations (buying/selling treasuries to increase/decrease the money supply) or else change the reserve requirement. Demand for reserves was weakly bounded by the interest rate on excess reserves (IOER) and the discount rate (the rate that the Fed charges banks for direct loans); banks had no reason to borrow at a higher rate than they could get directly from the Fed, and had no reason to lend at lower rates than they could get for simply holding their excess reserves. In Figure 1 below, we sketch a localized supply and demand curve for reserves under this framework.
Figure 1: Supply And Demand Curve In Limited Reserve Framework
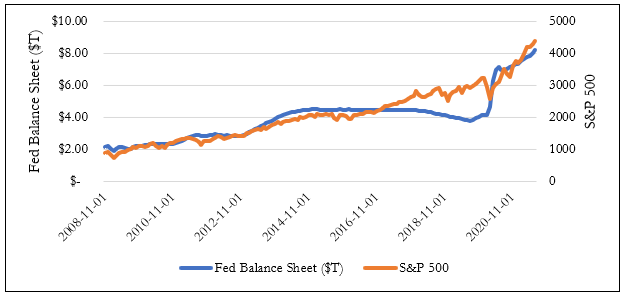
After the onset of the Great Recession, the Fed greatly expanded their tool kit with the introduction of Quantitative Easing (QE). Differing from normal open market operations primarily in size and scope, QE allowed the Fed to add longer dated securities and more exotic debt to their balance sheet in an effort to increase the money supply. This new framework was double-edged: with ample liquidity came the inability for normal open market operations to reliably affect rates. While some have worried that QE would lead to substantially higher inflation, it has been more closely tied to an increase in asset prices thus far (see Figure 2 below).
Figure 2: Balance Sheet Expansion and S&P 500
The second major change in Fed Policy came about as a result of the Coronavirus. To encourage lending, the Fed eliminated reserve requirements, enabling banks to earn interest on their entire reserve balance (IORB). In the era of ample reserves, the IORB is the primary administrative rate used to keep the FFR within the target range. More recently, however, a formerly little used aspect of the Fed has exploded in usage (see Figure 3 below). The rate in the overnight reverse repo facility (ON RRP), which is open to certain non-bank financial institutions, acts as another form of control on the Fed Funds Rate. Unlike simple overnight loans, repurchase agreements necessitate collateral, and as such generally have a lower implied interest rate than the IORB.
Figure 3: Reverse Repo Facility Average Daily Volume

This increase in reverse repos reflect financial institutions opting to achieve a small risk-free return rather than take additional risk. Essentially, a good portion of the $120 billion a month the Fed is creating through large scale asset purchases is being returned directly to the Fed, rather than injected into the economy as would be preferred. With inflation rising despite a low velocity, we think this may be a good indication that the Fed can afford to scale back its balance sheet expansion.
Different tools the Fed uses to implement monetary policies have different impacts on the yield curve. Normally, the Federal Open Market Operations and change of the discount rate will change the short-term rates. The quantitative easing and bond purchases, especially long-term bond purchases, will change the long-term interest rates. Recently, the Fed indicated it may taper the bond purchase program by the end of this year. We should expect the yield curve to steepen as a result.