Recently, a scary chart created by market pundit, Tom DeMark, has stirred Wall Street. He drew a striking parallel between the current market performance and the 1929 crash. The sell-offs in last few weeks tended to confirm his bearish prediction (see Chart One). So far in April, S&P 500 Index tumbled 2.9%, even worse, the small cap stocks represented by Russell 2000 Index plummeted 5.1%.
Chart One: Scary Chart by Tom DeMark
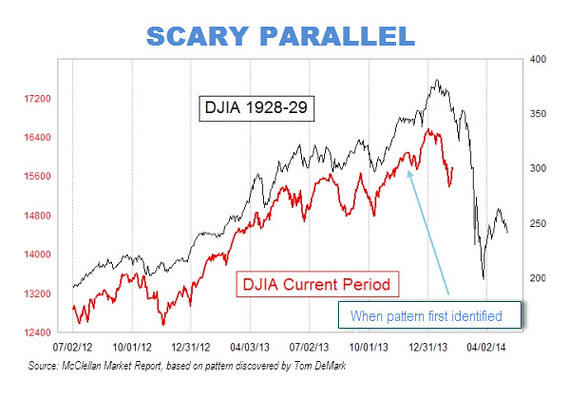
Investors are asking: is recent sell-off a temporary correction or the start of a bear market? At Julex, we believe that current sell-off is a correction in a continuing bull market though the correction could be significant in some of the more expensive sectors/regions. However, some of the less expensive sectors/regions could benefit from this correction. Our general assessments on the markets can be summarized as follows:
- The general market condition is still bullish. Coming out of the great recession in 2008, the US economy continues its recovery and expansion at a moderate pace. The Labor market is improving, but it is not strong enough for the Fed to abandon its loose monetary policy. Globally, Europe starts to recover from recession and debt crisis. The European Central Bank may lower interest rates to fight the possibility of deflation. In Japan, Abenomics, combining the super-size quantitative easing with fiscal stimulus to fight deflation, has provided a boost to the Japanese economy and showed significant progress in ending the decades-long sluggish economy. In China, the economy tends to stabilize around 7% growth rate though potential problems like over-valued real estates, non-performing bank debts and social inequality persist. Expanding global economies and cheap money will continue supporting risk-taking and stock markets.
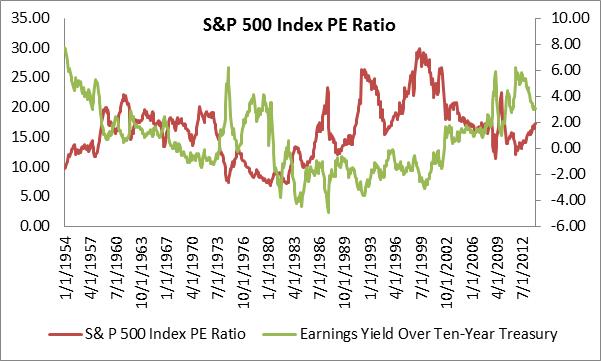
- Valuation in the US is above historical average, but it is not over-stretched by any measure. Current PE ratio of S&P 500 Index stands at 17, slightly higher than historical average 16. Analysts often like to measure richness/cheapness by comparing the PE multiple with the ongoing interest rates. Low interest rates tend to support higher PE on a discount dividend valuation formula. When measured by the spread of earnings yield and Ten-year Treasury rate, the current market is not expensive at all. The current spread is 3.06%, much higher than historical average of 0.63% dating back 1954 (see Chart 2). That means that equity markets still provide a decent risk premium over Treasuries.
Chart Two: S&P 500 Index PE Ratio
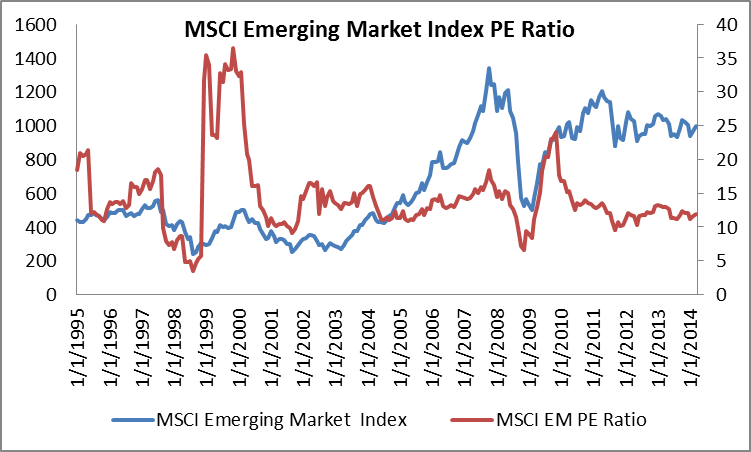
- Globally, on PE ratio basis, stocks are cheap. MSCI EAFE index, which is composed of stocks in the developed countries, is traded at a PE ratio of 18, well below its historical average of 28 since 1995 (see Chart 3). MSCI Emerging Market Index is traded at a PE ratio of 12, below historical average of 14 as well (see Chart 4).
Chart Three: MSCI EAFE PE Ratio
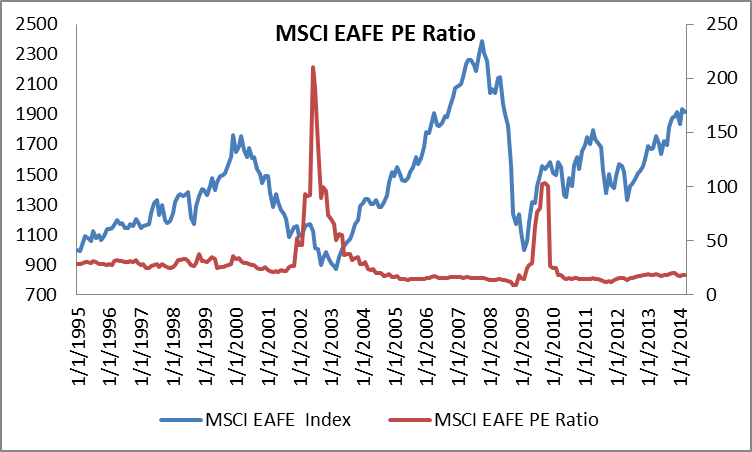
Chart Four: MSCI Emerging Market PE Ratio
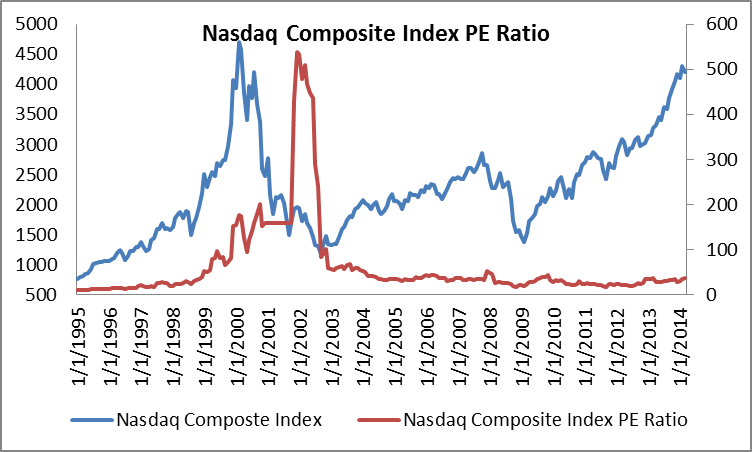
- The recent sell-off of hit tech stocks especially hard. Nasdaq Composite Index tumbled by 8.2% since March 5. With a current PE ratio of 35 and a forward PE of 19, the tech stocks are not cheap, but its valuation is not over-stretched. Since 1995, the Nasdaq Composite Index has been traded at an average PE ratio of 63 and median PE ratio of 32 (see Chart 5).
Chart Five: Nasdaq Composite Index PE Ratio
- So far in April, in contrast to the US markets, emerging market stocks gained 1.8%. Normally, when investors are scared and shed risks, EM stocks were hurt the most. This is just another piece of evidence that investors are not scared by the markets, but they are looking for better value.
News To Watch This Week
Monday:
US Retail Sales (Mar) and Business Inventories (Feb)
Tuesday:
US CPI (Mar); UK CPI (Mar); Germany Economic Sentiment (Apr)
Wednesday:
US Housing Starts & Industrial Production (Mar); Eurozone CPI (Mar); China Q1 GDP; Japan Industrial Production (Mar)
Thursday:
US Initial & Continuous Jobless Claims; Japan Tertiary Industry Index (Feb)
Friday:
China House Price Index (Mar)
Major Earnings Release This Week
Monday: Citigroup
Tuesday: Intel, Johnson & Johnson, Coca Cola
Wednesday: Bank of America, IBM
Thursday: Dupont, GE, Goldman Sachs