Is EM Ready to Rebound?
Investors in emerging markets equities had a disappointed year in 2013. The MSCI Emerging Market Index dropped over 2%, while the S&P 500 rallied 32%. In recent months, however, emerging market (EM) equities showed signs of life. Since the lows in early February, the EM index has risen by 12%. Emerging market equity fund flows, which had been negative for a record 22 consecutive weeks, turned positive recently. Some individual countries performed even better. In last three months, Brazil rose 19%, India climbed 13%, and Turkey gained the most by 26%. Is it time for EM to rebound? We think that EM may have hit the bottom and be ready to rebound, but it still faces many challenges. The positive factors are working in EM’s favor include:
(1) EM Is Relatively Cheap on P/E Basis
Relative to developed markets (DM), EM is cheap. As of March 31, EM is being traded only at 12.32 times earnings, whereas the MSCI World Index (which represents DM) is being traded at 17.52 times. The 12.32 times P/E is also lower than its historical average. From October 1995 to December 2013 the MSCI Emerging Markets Index has been traded at an average P/E of 16 times. The chart below shows the relative valuation of EM to DM. Currently the relative valuation is lower than the 15-year average of 0.74.
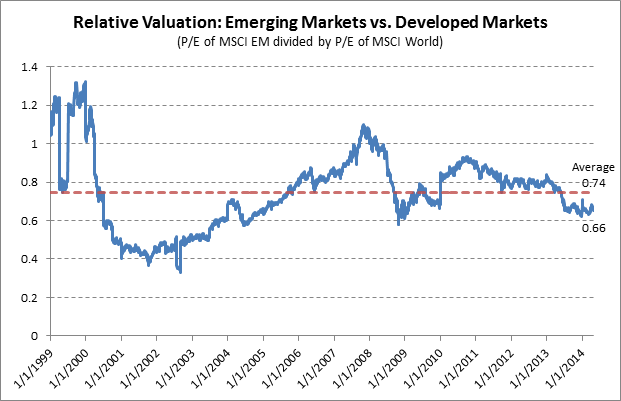
Source: Bloomberg
(2) The Market Trend for EM Has Turned Positive
The MSCI EM index has been trading above its 200-day moving average since mid-April. The corresponding ETF, the iShares MSCI Emerging Markets ETF (EEM), currently trading at 41.61, is above both its 50-day (40.36) and 200-day moving average (40.51). The market technicals has become more favorable.

Source: Ycharts
(3) EM Economies Are Stabilizing
After a year of disappointing corporate earnings and widespread economic slowdown in 2013, emerging economies have become more stable. The GDP growth rates have started to pick up again. Emerging market countries like India, Russia, Korea and Greece are expected to grow at a faster pace in 2014 and 2015, according to IMF (see the following table).
Real GDP Growth of Selected EM countries
| Country |
2012 |
2013 |
2014 |
2015 |
| Brazil |
1.0% |
2.3% |
1.8% |
2.7% |
| China |
7.7 |
7.7 |
7.5 |
7.3 |
| India |
4.7 |
4.4 |
5.4 |
6.4 |
| Korea |
2.0 |
2.8 |
3.7 |
3.8 |
| Russia |
3.4 |
1.3 |
1.3 |
2.3 |
| Taiwan |
1.5 |
2.1 |
3.1 |
3.9 |
| Greece |
-7.0 |
-3.9 |
0.6 |
2.9 |
Despite the positive factors, threats to EM rebound still exist. Political events like tensions in Ukraine can potentially pose a significant headline risks. Although a full-scale confrontation between Russia and the West is unlikely (see last week’s report), small scale conflicts can still have negative effects on Russian and European economies. 2014 is a major election year for emerging markets countries – 28% (by GDP) of emerging markets will have elections. Uncertainties of election outcomes may add risks to the capital markets.
In addition, Fed’s tapering and China’s slowdown, though most of their impacts have been priced in the markets, may derail the EM rebound if there is any unexpected negative development . Especially, China is undergoing a transition from an investment/export-driven growth model to one that is more oriented toward consumer spending. It is likely to experience some turbulence in the near and medium term.
Last, the cheap P/E of the EM index is largely attributed to the low P/E ratios in China and Russia (see the table below). Other EM countries don’t appear to be particularly cheap. In summary, we believe EM rebound is on the way, but we are also cautious.
|
Current |
10-year Average |
|||||||
|
Forward P/E |
P/B |
P/CF |
Dividend yield (%) |
Forward P/E |
P/B |
P/CF |
Dividend yield (%) |
|
| EM Index |
10.4 |
1.5 |
6.3 |
2.8 |
11.00 |
1.9 |
5.9 |
2.7 |
| Russia |
4.5 |
0.6 |
2.7 |
4.8 |
7.50 |
1.2 |
4.6 |
2.5 |
| China |
8.5 |
1.4 |
4.8 |
3.5 |
11.90 |
2.1 |
4.4 |
2.8 |
| Brazil |
10.1 |
1.3 |
6.0 |
3.9 |
9.90 |
1.9 |
5.6 |
3.4 |
| Taiwan |
14.4 |
1.8 |
7.2 |
3.0 |
14.20 |
1.8 |
6.3 |
3.7 |
| Korea |
9.0 |
1.1 |
5.7 |
1.2 |
9.60 |
1.4 |
5.2 |
1.7 |
| S. Africa |
14.2 |
2.6 |
12.5 |
3.1 |
11.30 |
2.4 |
8.6 |
3.3 |
| Mexico |
17.6 |
2.7 |
12.6 |
1.5 |
14.20 |
2.8 |
6.3 |
2.0 |
| India |
14.8 |
2.7 |
12.6 |
1.5 |
15.40 |
3.2 |
12.3 |
1.4 |
Source: MSCI, JP Morgan