It’s been over a decade since the S&P 500 Index bottomed at an intraday level of 666 on March 6th, 2009. It took four years from this bottom for the index to breach the high-water closing mark of 1,515 that it set in December 2007, and U.S. equities have rallied an eye-popping 318% (albeit with a few corrections along the way) since. This begs the question: can this bull market continue?
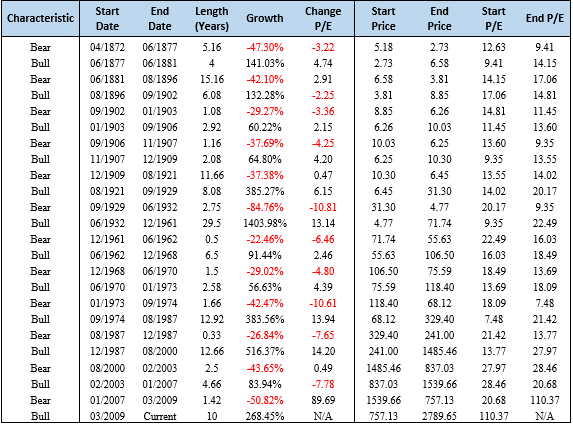
Following convention, we define bear markets as periods where the nominal price level of an equity index loses 1/5th of its value from a recent market peak. Table 1 shows the length and percentage of advances/declines for each market regime since 1872. On average, the 12 bull markets have lasted about 8.5 years and had a cumulative price return of just under 300%. This suggests that from a historical perspective, the recovery since the downfall of Lehman Brothers and Bear Stearns is not an outlier in terms of either length or scale. For comparisons sake, the market saw 516% appreciation over a 13-year period from the worst part of the 1987 crash to the onset of Y2K and the tech bubble, a run that has trumped this rebound considerably.
Table 1: Comparative Sizes of Recent Bull Markets (Using Average Monthly Prices)
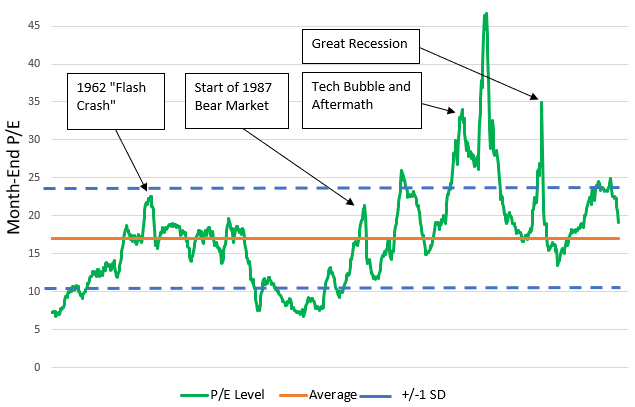
In examining the peaks of previous bull markets, it’s evident that oftentimes a spike in valuations coincides with a turn in the market. But stocks are getting cheaper in the U.S., not more expensive. Investors were paying over $21 for every dollar of company earnings in the lead up to Black Monday, almost $28 in the lead up to the tech bubble, and just under $26 prior to the subprime mortgage crisis. At the end of 2018, the P/E ratio of S&P 500 companies sat at just above 19 (using aggregate month-end pricing and earning data). While this is slightly higher than average, high PE multiples can normally be supported by low interest rates, and the late cycle fiscal stimulus can potentially keep economic expansion and earnings growth intact.
Figure 1: Month-End P/E Ratios Since 1950 (excluding 10 months during 2008-09 Recession)
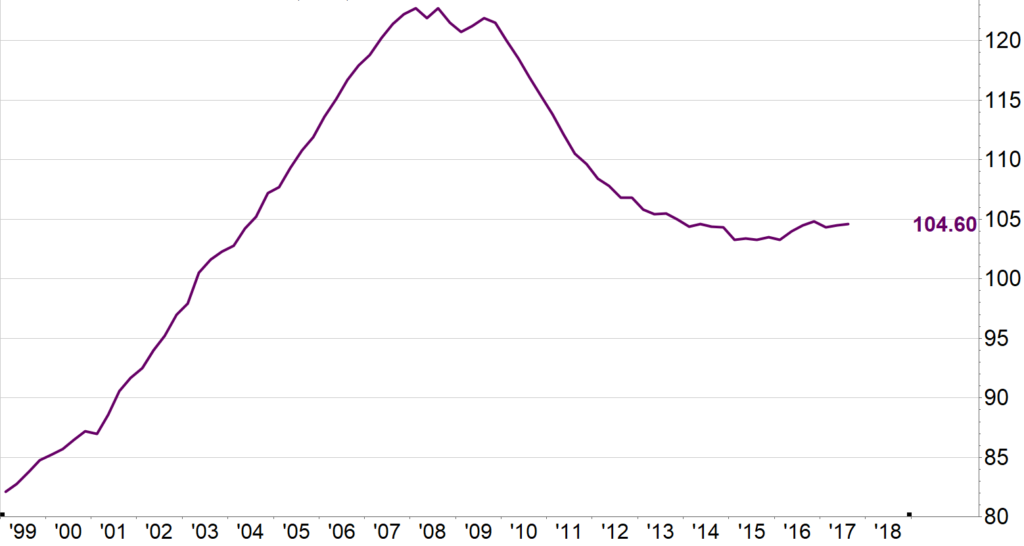
Many investors are worried that any potential credit problem may derail the stock market rally since it was the root cause of the last financial crisis. So far, borrowing and debt do not present significant risks. Figure 2 shows how debt was skyrocketing in the lead up to 2008, and how consumers are now carrying debt levels commensurate with historical averages. This points to the continued ability for consumers to spend, which in turn mutes fears for a credit crisis.
Figure 2: Household Debt to GDP Ratio
Based on historical comparisons, this bull market may still have room to grow. Earnings are likely to slow going forward, but stock prices are supportive of current corporate income levels. FactSet estimates 7% earnings growth in 2019. While the consensus estimate from analysts is a slow-down in domestic GDP growth, FOMC board members estimate growth between 1.8 and 2.3% in the coming years, hardly suggestive of a recession. Taken in aggregate, these realities suggest that it is not an unreasonable expectation this bull market can continue for a few more years.
Disclosures
Julex Capital Management is a SEC-registered quantitative investment management firm specializing in tactical and factor-based investment strategies. The firm offers a variety of tactical unconstrained investment solutions aiming to provide downside risk management while maximizing the upside potentials using its unique Adaptive Investment Approach. In addition, Julex offers active equity strategies to deliver security selection alpha uncorrelated with the traditional risk factors like size, value or momentum using its TrueAlpha(TM) multi-factor sequential screening approach.
The information in this presentation is for the purpose of information exchange. This is not a solicitation or offer to buy or sell any security. You must do your own due diligence and consult a professional investment advisor before making any investment decisions. The risk of loss in investments can be substantial. You should therefore carefully consider whether such trading is suitable for you in light of your financial condition.
The use of a proprietary technique, model or algorithm does not guarantee any specific or profitable results. Past performance is not indicative of future returns. The performance data presented are gross returns, unless otherwise noted.
All information posted is believed to come from reliable sources. We do not warrant the accuracy or completeness of information made available and therefore will not be liable for any losses incurred. No representation or warranty is made to the reasonableness of the assumptions made or that all assumptions used to construct the performance provided have been stated or fully considered.