The debate on active vs. passive investing has been heating up in last few years as investors are becoming more and more in favor of passive investment funds.
In fact, even the legendary investor Warren Buffett advocated investing in index funds in his most recent annual newsletter. He wrote “A lot of very smart people set out to do better than average in securities markets. Call them active investors. Their opposites, passive investors, will by definition do about average. In aggregate their positions will more or less approximate those of an index fund. Therefore, the balance of the universe—the active investors—must do about average as well. However, these investors will incur far greater costs. So, on balance, their aggregate results after these costs will be worse than those of the passive investors.”
The asset flows from active funds to passive funds, especially on the equity side, have been massive. According to Morningstar, for the one-year period ended in March, active equity mutual funds lost $340 billion in assets, while passive funds gained $462.5 billion (see Table 1 for more details).
Table 1. Morningstar Estimated Net Mutual Flows (as of March 31, 2017)
| Estimated Net Flows ($Million) | Active | Passive | ||
| 1 Year | Assets ($Bil) | 1 Year | Assets ($Bil) | |
| US Equity | (269,658) | 3,724 | 300,332 | 3,231 |
| Sector Equity | (31,024) | 390 | 57,294 | 443 |
| International Equity | (70,313) | 1,527 | 104,840 | 1,046 |
Source: Morningstar
There are two major factors driving the asset flows:
- Cyclical factors. Since the Great Recession, the stock market has been on a bull run for eight years now. Normally, as many people believed, it is harder for active managers to outperform during bull markets. In fact, only 19.8% of US large cap blend managers outperformed their passive counterpart in the last five years based on Morningstar research. Many active managers certainly hope the assets will flow back when the bear market arrives.
- Structural factors. If it is easier for active managers to outperform in the bear markets, then over a full market cycle the active managers should have a better chance to outperform. However, that is not the case. According to Morningstar, only 14% of active managers in the US large cap blend category outperformed passive funds over a ten-year horizon, which includes both bull and bear markets. This underperformance cannot be explained by cyclical reasons, but structural reasons: (a) “overcrowded” active management. There are too many active managers competing against each other so that the excess returns were squeezed out. (b) high fees and expenses, which create bigger hurdles for active managers to overcome.
We believe the recent asset flows are more driven by structural factors. The active managers who hope the current trend to be reversed once the bear market comes will be disappointed. An interesting question to ask is how far this trend will go or whether we are in a “passive bubble” as some people suggest. I developed a simple economic model in Figure 1 to shed some lights on the question.
Figure 1: An Economic Analysis on Active vs. Passive Investing
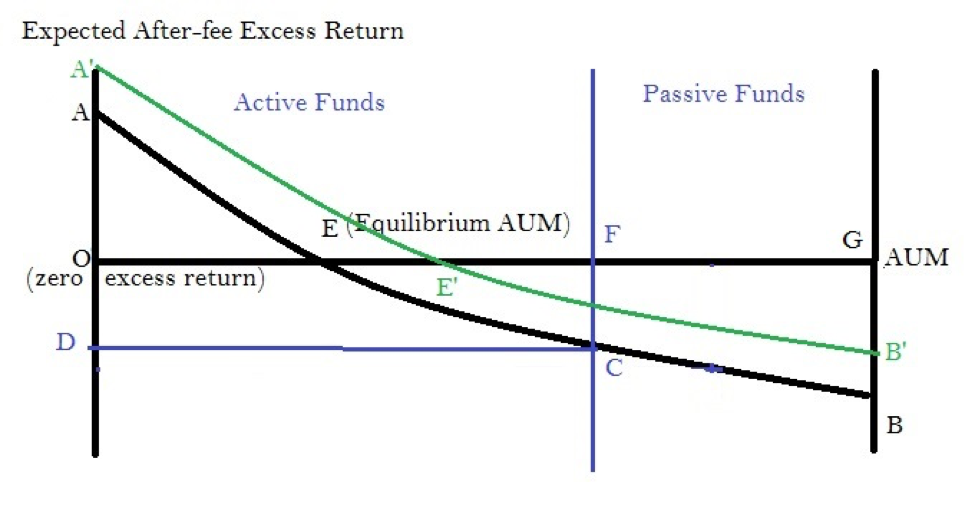
In Figure 1, the vertical axis represents the expected after-fee excess return for an average active manager, and horizontal axis represents the total asset under management. Curve AB, which we call active fund performance line, shows the relationship between excess return and AUM under active management. Intuitively, as the total AUM of active funds increases, the expected excess return of an average active manager decreases because more and more managers may chase the same investment opportunities. Theoretically, at point A where all the assets are in passive investments, the expected excess return of active funds is at highest level. At point B where all the assets are in active investments, the expected excess return of active funds is at the lowest level. On Line OG, the expected after-fee excess return is zero. Point E defines the equilibrium AUM levels. OE is the equilibrium active AUM, and EG is the equilibrium passive AUM. When the active AUM falls below OE, the expected after-fee excess return of an average active manager become positive, and more assets will flow to active management. On the other hand, when the active AUM exceeds OE, the expected after-fee excess return of an average active manager become negative, and assets will flow from active funds to passive funds to the equilibrium level OE.
Where are we in the graph? It is likely that we are at point C, where the expected excess return is negative. That means an average active manager adds negative value to investors’ portfolios. Based on Morningstar data, the ten-year annual excess return of active funds in the US large cap blend category was -1.2% as of 12/31/2016. In Figure 1, OF represents the current active AUM, which is bigger than the equilibrium active AUM (OE). The asset flows from active to passive investments are expected to continue until the expected excess return of an active fund is restored above zero level (Point E). Therefore, the recent outflows from active funds just reflect the economic reality from investors’ standpoint. There is no “passive bubble” here.
Another question we may want to ask: Is there any way that an active manager can stop or slow the outflows? In other words, how can we move the active performance curve AB higher to A’B’ so that the equilibrium active AUM can increase to OE’ in Figure 1? I offer some suggestions here:
- Be more active and flexible. The asset management industry has traditionally focused on managing against benchmarks and measuring risks with tracking errors. A manager is very much restricted by the benchmark. For example, an equity manager needs to be fully, or at least 80%, invested in equity all the time even if he believes the market is heading lower. This benchmark-centric approach hampers the manager’s ability of generating alpha. A more flexible and active approach, especially in terms of generating alpha during market downturns by moving towards more defensive positions or cash will help active managers to outperform during a full market cycle.
- Concentrate your bets. Another drawback of benchmark-centric thinking is that the managers are so scared of building a portfolio that is too different from their benchmarks. Instead of taking bets only on the high conviction ideas, they diversify their bets across a large number of positions and become a “closet indexer”. With a higher fee, a “closet indexer’ is highly likely to underperform. To generate excess return, a manager needs to invest in a concentrated portfolio reflecting only his best ideas.
- Lower your fees. There is a clear inverse relationship between fees and outperformance. A Morningstar study shows that the active funds in the US large cap blend category with fees in the 25th percentile have 22.8% chance to outperform, but the active funds with fees in the 75th percentile have only 4.8% chance. To lower fees, an active manager needs to operate more efficiently and cut costs.
- Use technology and quantitative methods. With abundance of financial data, quantitative methods and technology like machine learning provide certain advantages over human analysts. They can digest large amounts of data quickly and avoid human emotional bias in the investment decision-making process. Additionally, technology and quantitative methods can help improve operational efficiency and reduce costs. That will in turn offer the possibility for an active manager to lower management fees, and thus improve the chance for outperformance.
Disclosure
This article is for the purpose of information exchange only. It is not a solicitation or offer to buy or sell any security. You must do your own due diligence and consult a professional investment advisor before making any investment decisions. All information posted is believed to come from reliable sources. We do not warrant the accuracy or completeness of information made available and therefore will not be liable for any losses incurred.
[fny id=”1″]